
Task 4
Use the data in Task 4 of the ‘Engagement project.xlsx’ to solve the following task.
You want to reach a data-driven customer engagement decision on whether the platform’s new features contribute to the increase of minutes watched on the platform for both free-plan and paying students—i.e., the rise in student engagement in their study process. To do that, use hypothesis testing on both groups (free-plan and paying) for 2021 and 2022.
Your null hypotheses should include the following:
- The engagement (minutes watched) in Q4 2021 is higher than or equal to the one in Q4 2022 (μ1 ≥ μ2). We test free-plan and paying students separately.
Additionally, make the following assumptions:
- For free-plan students, perform a two-sample t-test assuming unequal variances.
- For paying students, conduct a two-sample t-test assuming unequal variances.
Optional: Perform a two-sample f-test for variances to support the assumptions.
What conclusion can you draw from this test? Comment on the results of committing a Type I or a Type II error in this study. Which one would result in higher costs for the company?
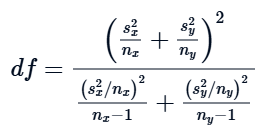
Tip: The degrees of freedom are calculated using the following formula for independent samples with unknown variances which are assumed to be unequal:

Note: Assume that the degrees of freedom are equal to 8,229 and 40,836 for paid- and free-plan students, respectively.
The t-test is equal to the following:

Where:
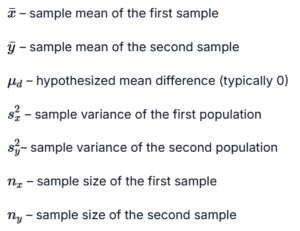
First, you must perform a two-sample f-test for variances to prove the assumption of unequal variances between the samples for free- and paid-plan subscribers. If you have the Data Analysis ToolPak installed in Excel, you can use it (as seen below) to perform the two-sample f-test for variances.
In the Data Analysis dialog box, select F-Test Two-Sample for Variances from the list of analysis tools and click OK.

In the F-Test Two-Sample for Variances dialog box, specify the Sample 1 and 2 ranges. You can enter the cell ranges manually or use the range selection tool to select the data in your worksheet.

Check the Labels box if your data has headers so Excel can treat them as labels.

Choose whether you want the output in a new worksheet or a specific location in your current worksheet. Click OK to run the analysis.
Excel will perform the f-test for variances and provide the test statistic (f-value) and the p-value. The p-value would indicate the probability of obtaining the observed f-value if the null hypothesis (equal variances) were true.
As mentioned, compare the p-value to your chosen significance level (alpha) to determine if the variances are significantly different. If the p-value is less than or equal to your alpha level, you can reject the null hypothesis of equal variances.
The next step is to perform a t-test and compare it to the critical value from the t-distribution.
Consider the following steps for paying students where the variances are assumed unequal.
1. Specify the significance level :
2. Calculate the t-statistic using the following formula:

3. Look up the critical t-value using a t-distribution table (https://365datascience.com/calculators/tables/std-table/) to correspond to your chosen significance level (commonly 0.05) and calculated degrees of freedom.
4. Note that the degree of freedom is calculated using the following formula for independent samples with unknown variances which are assumed to be unequal:
The degrees of freedom are assumed to be equal to 8,229.
Compare t-statistic to critical t-value. Interpret the magnitude and the sign of your t-statistic. The decision rule—based on the critical value approach—is as follows:

Assume that the critical t-value equals 1.65.
The decision rule—based on the p-value approach—is as follows:

Alternatively, you can use the Data Analysis ToolPak in Excel to obtain the result directly:
1. Click on Data Analysis in the Analysis group. Select ‘t-Test: Two-Sample Assuming Unequal Variances’ from the list of analysis tools and click OK.

2. In the ‘t-Test: Two-Sample Assuming Unequal Variances’ dialog box, specify for Sample 1 and 2 ranges.

3. Enter your desired significance level (alpha) in the Alpha field. Choose whether you want the output in a new worksheet or a specific location in your current worksheet.
Excel will perform the two-sample t-test assuming unequal variances and provide the results, including the t-statistic, degrees of freedom, and the p-value. The p-value would indicate the probability of obtaining the observed t-statistic if the null hypothesis (no difference between means) were true.
Compare the p-value to your chosen significance level (alpha) to determine if the difference between the means of the two samples is statistically significant. If the p-value is less than or equal to your alpha level, you can reject the null hypothesis of similar means.
Task 5
Your last task is determining whether the average number of minutes watched in the US is similar to that in India.
Understanding the differences in usage patterns can help in product localization. The platform might need to tailor its content, features, or user interface to better fit the preferences or needs of users in different regions.
You’ll focus only on free-plan students in 2022. Use the Excel sheet Task 5 to perform your calculations.
Your null hypotheses should (respectively) include the following:
- The engagement (minutes watched) in the US is higher than or equal to that in India (μ1 ≥ μ2). We test only free-plan students.
- The engagement (minutes watched) in the US is lower than that in India (μ1 < μ2). We test only free-plan students.
Additionally, perform a two-sample t-test assuming unequal variances.
Optional: Perform a two-sample f-test for variances to support the assumptions.
What conclusion can you draw from this test? Is the engagement in the US higher than that in India?
Tip: Note that the degrees of freedom are calculated using the following formula for independent samples with unknown variances which are assumed to be unequal:

Note: Assume that the degrees of freedom are equal to 11,001.
The t-test is equal to the following:

First, you must perform a two-sample f-test for variances to prove that assumption of unequal variances between the samples (minutes watched by free-plan subscribers in the US and India):

Excel will perform the f-test for variances and provide the test statistic (f-value) and the p-value. The p-value would indicate the probability of obtaining the observed f-value if the null hypothesis (equal variances) were true.
As mentioned, compare the p-value to your chosen significance level (alpha) to determine if the variances are significantly different. If the p-value is less than or equal to your alpha level, you can reject the null hypothesis of equal variances.
The next step is to perform a t-test and compare it to the critical value from the t-distribution.
Consider the following steps for hypothesis testing where the variances are assumed unequal:
1. Specify the significance level:
2. Calculate the t-statistic using the following formula:
3. Look up the critical t-value using a t-distribution table (https://365datascience.com/calculators/tables/std-table/) to correspond to your chosen significance level (commonly 0.05) and calculated degrees of freedom.
4. Note that the degrees of freedom are calculated using the following formula for independent samples with unknown variances which are assumed to be unequal:
Note: Assume that the degrees of freedom are equal to 11,001.
5. Compare t-statistic to critical t-value. Interpret the magnitude and the sign of your t-statistic. The decision rule—based on the critical value approach—is as follows:
Assume that the critical t-value is equal to 1.65.
The decision rule—based on the p-value approach—is as follows:
Alternatively, you can use the Data Analysis ToolPak in Excel to obtain the result directly:

Excel will perform the two-sample t-test assuming unequal variances and provide the results, including the t-statistic, degrees of freedom, and the p-value. The p-value would indicate the probability of obtaining the observed t-statistic if the null hypothesis (no difference between means) were true.
Compare the p-value to your chosen significance level (alpha) to determine if the difference between the means of the two samples is statistically significant. If the p-value is less than or equal to your alpha level, you can reject the null hypothesis of similar means.