Task 3
Please open the ‘Engagement project.xlsx’ file and navigate to the ‘Task 3 sheet using Microsoft Excel.
You will find information about two pairs of students:
- Students who haven’t had a paid-plan subscription
- Engaged in Q4 2021
- Engaged in Q4 2022
- Students who have been paid-plan subscribers
- Engaged in Q4 2021
- Engaged in Q4 2022
For each of the four groups, determine the minute interval within which you can be 95% confident that a randomly selected individual will be situated.
What conclusions can you draw about the students’ engagement in Q4 2021 and Q4 2022?
Tip: Use the z-statistic when performing calculations.
Follow the general steps below to compute confidence intervals in Excel:
1. Determine your sample size (n)—the count of the number of observations in your data.
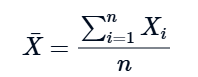
2. Calculate the sample’s mean value:
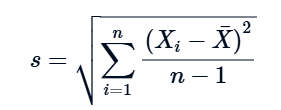
3. Determine the sample’s standard deviation:
4. Estimate the significance level:
In this case, the confidence level is 95%.
5. Obtain the z-score from the standard normal distribution table for probability (p) = 1 – α/2.
Note that you can assume normality since the sample size is larger than 30. The z-score for a 95% confidence interval is 1.96.
6. Calculate the standard error:
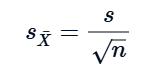
This is the standard deviation divided by the square root of the sample size. The SQRT function can be used to calculate the square root.
7. Calculate the margin of error:
This is the critical value—typically a z-score for a normal distribution, 1.96 for a 95% confidence interval—multiplied by the standard error. You can directly multiply by 1.96, assuming a normal distribution.
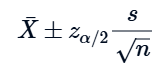
8. Calculate the confidence interval by adding and subtracting the margin of error from the mean value: